RabbitMQ Management Plugin
The rabbitmq-management plugin provides an HTTP-based API for management and monitoring of your RabbitMQ server, along with a browser-based UI and a command line tool, rabbitmqadmin.
Features include:
- Declare, list and delete exchanges, queues, bindings, users, virtual hosts and permissions.
- Monitor queue length, message rates globally and per channel, data rates per connection, etc.
- Send and receive messages.
- Monitor Erlang processes, file descriptors, memory use.
- Force close connections, purge queues.
- If you change configuration settings you must restart the Apache Service for the changes to take effect. First start the service and then start it again. Do not use the "Restart" option
- PrismMQ uses Erlang. In certain conditions, users have reported a "Failed to copy Erlang Cookie" or "Failed to find Erlang Cookie" message when a server is part of a domain. If you encounter this error message, try logging in as a local administrator (instead of using a network account) and run the installation again
- When all messages are processed, a new PrismMQ Complete flag (hidden field) is set to true, and the status changes from "Processing" to "Completed"
Launch RabbitMQ Management Plugin
- In the browser address area, switch from "https" to "http". Clear the port information and anything after. Enter 15672 as the port. Press the Enter key.
- Enter the following login information and then tap or click the Login button. Username: prismguest Password: prismguest

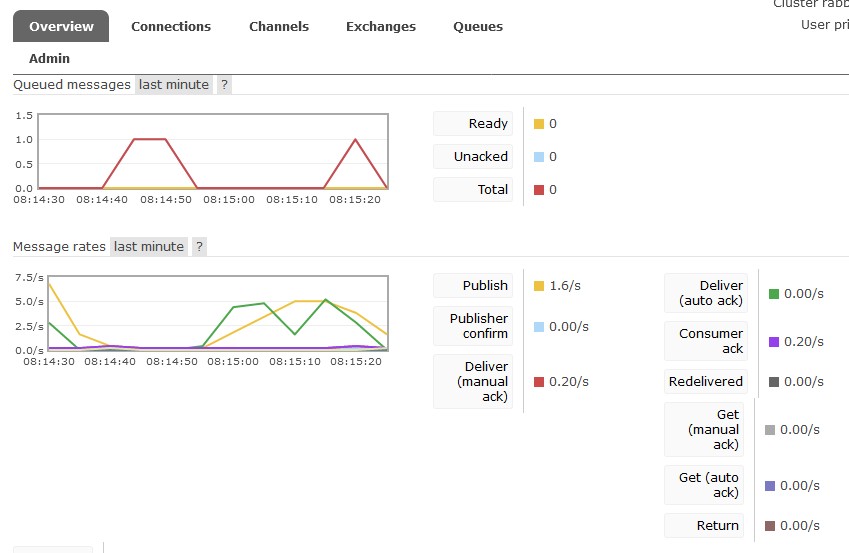
- Select the tab for the area you want to work with. Below are sample line charts on the Overview tab showing queued messages and message rates.
- When finished, click the Log out button.
Refer to the following table for a description of the tabs on the RabbitMQ Console:
| Tab | Description |
|---|---|
| Overview | This tab enables you to see how message processing is progressing over time. The data is displayed in a line chart format. One line chart shows queued messages (Ready, Unacknowledged, Total). Another line chart shows message rates (Publish, Deliver, Acknowledge, Deliver - no ack). |
| Connections | This tab shows connections. You can filter the list. Click the HTTP API or Command Line links to display information about using the API. |
| Exchanges | Select an Exchange in the Name column to view details for the Exchange. The displayed info includes Message rate in and Message rate out |
| Queues | View messages and message rates . Messages: Ready, unacknowledged, total Message rates: (messages per second) Incoming, deliver(get), ack |
RabbitMQ Log Files
Prism uses RabbitMQ messaging service for data replication. RabbitMQ logs can provide valuable information for troubleshooting, especially issues related to replication.
RabbitMQ Log Management Best Practice for Prism
Change your RabbitMQ log level. Changing the log level will save hard drive space, reduce administration tasks and make it easier to search logs for errors. These log level settings are recommended by the Retail Pro Professional Services Team. You can find additional information about configuring RabbitMQ logs on the RabbitMQ website and on GitHub. The default log level in RabbitMQ is Info which is one severity below debug. When logging is set to the Info level, log entries will be recorded for events in the Info level and below, which includes Info, Warning, Error and Critical. This means that by default, only debug-level events are excluded from the logs. This is quite a lot of detail to include in the logs and is typically not necessary in a production environment. Instead, change the RabbitMQ log level to Error at each installation.
To edit the RabbitMQ log level:
Navigate to the C:\ProgramData\RetailPro\Server\RabbitMQ directory. Edit the file and change the contents to reflect the text in the log file below.
[{lager, [
{handlers, [
{lager_file_backend, [(file, "error.log"),
{level, error},
{date, "$00"},
{size, 10485760},
{count, 10}]}
]}]}]
Refer to the following table for an explanation of the configuration file contents:
| Line entry in rabbitmq.config | Description |
|---|---|
| {file, "error.log"}, {level, error} | Tells lager to log errors and above messages to error.log |
| {size, 10485760}, {date, "$00"} | Tells lager to rotate the file at midnight or when it reaches 10mb, whichever comes first |
| {count, 10} | Tells lager to keep 10 rotated logs in addition to the current one. Setting the count to zero does not disable rotation. Instead, it rotates the file and keeps no previous versions. |
| {size, 0}, {date, " "} | To disable rotation, set size to zero and the date to " " |
"$D0" (D-zero) Syntax
The $D0 syntax is taken from the syntax newsyslog uses in newsyslog.conf. The relevant extract follows.
Day, week, month and time format
The lead-in character for day, week and month specification is a '$' sign. The format of the day, week and month specification is: [Dhh], [Ww[Dhh]] and [Mdd[Dhh]], respectively. Hour specification is added on top of this, displayed as [Hmm]. Optional time fields default to midnight.
| Range | Specification |
|---|---|
| w | Day of week Range 0 ... 6, 0 = Sunday |
| dd | Day of month Range: 1 ... 31, or the letter L or l to specify the last day of the month |
| hh | Hours Range: 0 ... 23 |
| mm | Minutes Range: 0 ... 59 |
Examples
| "$D0" Characters | Meaning |
|---|---|
| $D0 | Rotate every night at midnight |
| $D23 | Rotate every day at 23:00 hr |
| $W0D23 | Rotate every week on Sunday at 23:00 hr |
| $W5D16 | Rotate every week on Friday at 16:00 hr |
| $M1D0 | Rotate on the first day of every month at midnight (i.e., the start of the day) |
| $M5D6 | Rotate on every 5th day of the month at 6:00 hr |
| $H00 | Rotate every hour at HH:00 |
| $D12H30 | Rotate every day at 12:30 |
| $W0D0H0 | Rotate every week on Sunday at 00:00 |