Auto Min/Max
Auto Min/Max calculates the desired Min (minimum) and Max (maximum) stock levels for Inventory items. The Min and Max stock levels that are calculated help retailers maintain adequate on-hand quantity levels for items. The Auto Purchasing and Auto Transfers tools use the values generated by Auto Min/Max when generating lists of proposed items for auto-generated purchase orders and transfer orders.
When calculating New Min/New Max values, Auto Min/Max analyzes sales history for a specific date range and applies one or more formulas to determine the optimum minimum and maxim values for Inventory.
Formulas can calculate Min/Max levels based on:
- Fewer or more Days of Supply
- A larger or smaller percentage of Annual Sold Qty
By default, the sales analysis will include all items; however, users can apply an Item Filter as part of the formula to include only sales of items that meet the filter criteria.
Glossary
| Term | Description |
|---|---|
| Annual Sold Qty | (used when formula type is set to Annualized) The Annual Sold Qty is the quantity that would be sold per year based on the quantity sold during the Analysis Date Range. For example, if the Analysis Date Range is set to a single day like Yesterday or Today, and 50 units were sold, the Annual Sold Qty will be 50 multiplied by 365 or 18,250. If the Analysis Date Range is Month to Date and 100 units were sold during the month, the Annual Sold Qty will be 100 multiplied by 12 or 1,200. Annualized formulas use the greater of/lesser of the Percentage of the Annual Sold Qty or the hard-coded Qty. For example, a formula could use the greater of two percent of Annual Sold Qty or 25. Please note that if the date filter is set to a date before the item's Created Date, Auto Min/Max will use the item's Created Date. For example, if the date filter is set to evaluate from 01/01/2023 to 01/01/2024 and there is an item created on 12/01/2023, Auto Min/Max will only evaluate documents from 12/01/2023 - 01/01/2024 |
| Average Sold per Day | (used when formula type is set to Days of Supply) The average daily quantity sold for an item. This is based on the sales analysis for the defined date range. |
| Days of Supply | The number of days of supply that exists in Inventory, based on Average Sold per Day. |
| Max | Quantity value assigned to an item to designate the desired highest stock quantity (to avoid purchasing/storing unneeded quantities of the item). |
| Min | Quantity value assigned to an item to designate the desired lowest stock quantity (to avoid the item becoming out of stock). |
| New Max | Proposed Max value based on Auto Min/Max analysis. The Update operation copies New Max to Max (and clears New Max). |
| New Min | Proposed Min value based on Auto Min/Max analysis. The Update operation copies New Min to Min (and clears New Min). |
Sample Use Cases
The Auto Min/Max tool is flexible enough to handle a variety of use cases, depending on the retailer's needs:
| Use Case | Description |
|---|---|
| Use Auto Min/Max at Stores to calculate Store Min/Max values | Auto Min/Max is calculated at a store installation, for that store. The values are reviewed and adjusted by a store buyer/manager. Auto Min/Max is updated at the store. Afterwards, orders are generated at the store, based on local Min/Max values. |
| Use Auto Min/Max at Corporate to calculate Store Min/Max values | Auto Min/Max is calculated at a corporate installation (POA), for a variety of stores. The values are reviewed and adjusted by a corporate buyer/manager. Auto Min/Max is updated at the POA. Afterwards, orders are generated at the POA, based on local Min/Max values |
| Use Auto Min/Max at Corporate to calculate Company Min/Max values | Auto Min/Max is calculated at a corporate installation (POA), for a variety of stores. The values are reviewed and adjusted by a corporate buyer/manager. Auto Min/Max is updated at the POA. Company Min/Max values are updated (option). Afterwards, orders are generated at the POA, based on local Company Min/Max values. |
| Manual Min/Max | Although somewhat counter-intuitive, it is possible to manually enter desired Min/Max values into the New Min and New Max fields in Inventory and then run the Update function in Auto Min/Max to write the New Min/Max values to the Min/Max fields. This could be used, for example, to fine-tune New Min/New Max values on an item-by-item basis |
| Copy Min/Max | Min/Max values are calculated for a store. Another store (i.e., new store) does not have desired Min/Max values. Min/Max values are copied from one store to another |
| Clear Min/Max | Min/Max values are calculated for a store but not desired. Min/Max values are cleared for that store |
Basic Steps for Auto Min/Max
1. Navigate to Store Operations > Auto Tools > Auto Min Max.
2. Enter "Calculate Min/Max" and configure Auto Min/Max settings:
- Date Ranges
- Store Selection
- Formulas
3. Run Auto Min/Max with the configured settings.
4. Enter "Review Min/Max" and review the New Min Qty/New Max Qty. Edit values for individual items, if needed.
5. Update Min/Max. Min/New Max values are cleared.
Auto Min/Max Security
You can control employee access to the Min/Max utility using the following security permissions:
| Permission | Description |
|---|---|
| Auto Tools - Access Auto Utilities | Allow group members to access Prism auto utilities. This permission is required in addition to the permission for accessing Auto Min/Max. |
| Auto Tools - Access Auto Min/Max | Allow group members to access Auto Min/Max and enable the feature in preferences. This permission is required in addition to the permission for accessing Auto Utilities |
| Auto Tools - Configure Auto Min/Max | Allow group members to change Auto Min/Max configuration. |
| Auto Tools - Calculate Auto Min/Max | Allow group members to calculate Min/Max. |
| Auto Tools - Update Auto Min/Max | Allow group members to update the Min/Max values in Inventory with the New Min/Max values proposed by Auto Min/Max. |
Access Auto Min/Max
Navigate to Store Operations > Auto Tools.

Click Auto Min/Max.
Auto Min/Max has two main areas: Calculate Min/Max and Review Min/Max. The Calculate Min/Max area is where users define the sales analysis date range, select stores and add/edit formulas. The Review Min/Max area is where users review the proposed list of items and then, if satisfied, update..

Calculate Min/Max
When calculating New Min/New Max values, Auto Min/Max analyzes sales history for a specific date range and applies one or more formulas to determine the optimum minimum and maximum values for Inventory.
Formulas can calculate Min/Max levels based on:
- Fewer or More Days of Supply
- A larger or smaller percentage of the Annual Sold Qty
Users can save configuration settings and then reload those settings as needed in the future. This enables different configuration settings to be used for different situations or market conditions.
1. Navigate to Store Operations > Auto Tools > Auto Min/Max > Calculate Min/Max.
2. Click the New button at the bottom of the screen. The fields on the Calculate Min/Max screen become editable, allowing users to define new settings, including:
- Subsidiary (Auto Min/Max is run for a single subsidiary only)
- Date Range (limits the documents included in the analysis)
- Stores (include any or all stores for the selected Subsidiary)
- Formulas (refer to the Formulas section for information about the available formulas)
Sample Calculate Min/Max screen with New button enabled:

3. Save the changes.
Refer to the following sections for additional details.
Subsidiary
Each Auto Min/Max sales analysis is for a single subsidiary. Select the desired Subsidiary from the drop-down. The Stores section of the screen is updated based on the selected Subsidiary. Within the selected subsidiary, all stores can be included in the Auto Min/Max sales analysis or a selected subset of stores.
Load Configuration
If there are previously defined configurations, users can select the desired configuration from the Load Configuration drop-down. Loading a configuration will update the fields on the Calculate Min/Max screen. Users can then click the Edit button, modify the configuration as needed and save the updated settings with a unique Name.
Analysis Date Range
Prism will analyze the sales history for the user-defined date range. Predefined date range options are available, or users can manually select a Start Date and End Date.
The date range selected for the analysis can play a key role in determining the final values generated whether using Days of Supply or Annualized formula type. Both formula types examine sales history for the define date range and use that history to determine how many units are sold per day or on an annualized basis. If the data encompassed by the selected date range is not representative, then the proposed New Min Qty/New Max Qty values may not be useful. For example, a too-short date range may be comprised of days when sales were either far above or far below normal.
When there are multiple date ranges, only the days within date ranges are considered and summed together. Repeated days will be counted once. Gaps between the date ranges will be ignored.
If the date filter is set to a date before the item's Created Date, Auto Min/Max will use the item's Created Date. For example, if the date filter is set to evaluate from 01/01/2023 to 01/01/2024 and there is an item created on 12/01/2023, Auto Min/Max will only evaluate from 12/01/2023 - 01/01/2024
| Database Identifier | Selection | Description |
|---|---|---|
| 0 | None | By default, no date range is selected. All sales are included. |
| 1 | Fixed Date | Select a specific Start Date and End Date for the date range. Click the calendar icon to select a date. |
| 2 | XDaysXDaysAgo | Enter how many days of data to analyze and how many days ago that analysis should start |
| 3 | XweeksXWeeksAgo | Enter how many weeks of data to analyze and how many weeks ago that analysis should start. |
| 4 | XMonthsXMonthsAgo | Enter how many months to analyze and how many months ago that analysis should start. |
| 5 | Today | Sales for the current date are analyzed. |
| 6 | Yesterday | Sales for the prior day are analyzed. |
| 7 | WTD | Week to date. In Prism, the week starts on Monday. If the current day is Thursday, WTD is Monday to Thursday. (Note: In Retail Pro 9, the week starts on Sunday). |
| 8 | MTD | Month to date. For example, if today is the 25th day of the month, MTD is the first of the month to the 25th. |
| 9 | YTD | Year to date. If today is August 30, the YTD is January 1 to August 30. |
Stores
Select the Stores whose sales will be included in the sales analysis. If a store is not selected, it's sales will not be included in the sales analysis. The stores available for selection are limited to the active stores for the selected Subsidiary. (Note: The store selections made on the Calculate Min/Max screen determine which stores' sales will be included in the sales analysis. During the update operation, the user selects which stores will have their Min/Max values updated. Users can select one group of stores for the analysis and but update Min/Max for a different group of stores.)
Sample calculate Min/Max screen showing stores 000, 001 and 002 selected; these will be the only stores whose sales will be analyzed and used to calculate Min/Max values:

Formulas
Each Min/Max configuration contains one or more formulas. Each formula is a set of rules for calculating the New Min/New Max values for items.
There are two formula types: Days of Supply and Annualized.
- Use the Days of Supply formula type to calculate Min/Max values based on fewer or more Days of Supply. For example, the Min Qty should be the greater of 10 days of supply or 25.
- Use the Annualized formula type to calculate Min/Max values based on a smaller or larger percentage of the Annual Sold Qty. For example, the Max Qty should be the lesser of 30 percent of Annual Sold Qty or 100.
Users can use the same formula type for calculating New Min/New Max, or different types. For example, users can calculate New Min Qty using a formula type of Days of Supply and calculate New Max Qty using a formula type of Annualized. Formulas can be applied to selected items (using Item Filter) or to all items (no Item Filter).
Formula Types: Days of Supply and AnnualizedThis section has additional details about the Days of Supply and Annualized formula types.
Formula Type - Days of Supply
The Days of Supply formula type calculates the number of items that would last the specified number of days before selling out, assuming the daily rate of sale remains the same as the date range selected for the analysis. When the Formula Type is set to Days of Supply, users enter a Days of Supply and Qty and select a Condition operator.
| Element (Days of Supply formula type_ | Description |
|---|---|
| Days of Supply | Enter the desired number of Days of Supply. For example, entering 10 means the number of units required to keep the item in stock for 10 days before selling out, assuming the rate of sale remains the same as the date range selected for the analysis. |
| Qty | Enter a specific quantity that will be compared to the Days of Supply value. |
| Condition | Depending on the results of the Days of Supply calculations and the Condition operator, either the calculated Days of Supply value or the Qty value will be proposed as the New Min Qty/New Max Qty. By default, the Condition operator is set to "Greater Than." When the Condition dropdown is set to "Greater Than," Auto Min/Max will compare the calculated Days of Supply quantity to the Qty value and use the larger of the two values. When the Condition dropdown is set to "Less Than," Auto Min/Max will compare the calculated Days of Supply quantity to the Qty value and used the smaller of the two values. |
Days of Supply Formula Type calculation
The following formulas are used to calculate Min/Max values when using the "Days of Supply" formula type:
| Value | Formula |
|---|---|
| New Min Qty | greatestOrLeast(minDaysOfSupply * soldPerDay, userDefinedMinQty) |
| New Max Qty | greatestOrLeast(maxDaysOfSupply * soldPerDay, userDefinedMaxQty) |
soldPerDay = totalNumSold / numOfDays (as selected in the date range)
Formula Type - Annualized
When the Formula Type is set to Annualized, Auto Min Max analyzes sales and calculates the Annual Sold Qty. When the formula type is set to Annualized, users enter a Percentage and Qty and select a Condition operator.
| Element (Annualized formula type) | Description |
|---|---|
| Percentage | The percentage of the Annual Sold Qty to be compared to the specified Qty value. |
| Qty | Enter a specific quantity that will be compared to the calculated Percentage value. |
| Condition | Depending on the results of the annualized sold quantity calculation and the Condition operator, either the calculated Percentage of the Annual Sold Qty or the hard-coded Qty value will be proposed as the New Min Qty/New Max Qty. When the Condition dropdown is set to "Greater Than," Auto Min/Max will compare the calculated Percentage quantity to the Qty value and use the larger of the two values. When the Condition dropdown is set to "Less Than," Auto Min/Max will compare the calculated Percentage quantity to the Qty value and used the smaller of the two values. By default, the Condition operator is set to "Greater Than." |
Annualized Formula Type Calculation
The following formulas are used to calculate "Annualized" formula type:
| Value | Formula |
|---|---|
| New Min Qty | greatestOrLeast(minAnnualPercentage / 100 * soldPerYear, userDefinedMinQty) |
| New Max Qty | greatestOrLeast(maxAnnualPercentage / 100 * soldPerYear, userDefinedMaxQty) |
Note: soldPerYear = totalNumSold / numOfDays * 365
Note: numOfDays can include all the days in the given date range(s) or just those days where the item was in stock (depending upon the IncludeOutOfStock parameter).
Running Auto Min Max with Multiple Formulas
Multiple formulas can be defined and used for a single Auto Min/Max configuration. If the configuration includes two or more formulas with overlapping item filters (i.e., filters that apply to any of the same items), the proposed New Min Qty/New Max Qty are calculated by the last formula record that is run.
Formulas are run in the order they appear on the Calculate Min/Max screen. This last in, last out functionality allows users to strategically run formula records with overlapping filters, if needed. Run formula records with more general filter criteria first, and then records with more specific criteria. For example, say you have a formula record that you want to apply to all items in one department, except for the items that are assigned to a particular vendor (you have another formula record that will be applied to the latter). You can easily accomplish this by assigning a filter for the department to the first formula record, and a filter for the department and the specific vendor to the second formula record. Then run the record for the department first, and the record for the department and vendor second. The proposed Min and Max levels calculated by the second record will overwrite those proposed by the first for the applicable items.
New Formula
To create a new formula, click the blue "plus sign" button in the Add Formula area.
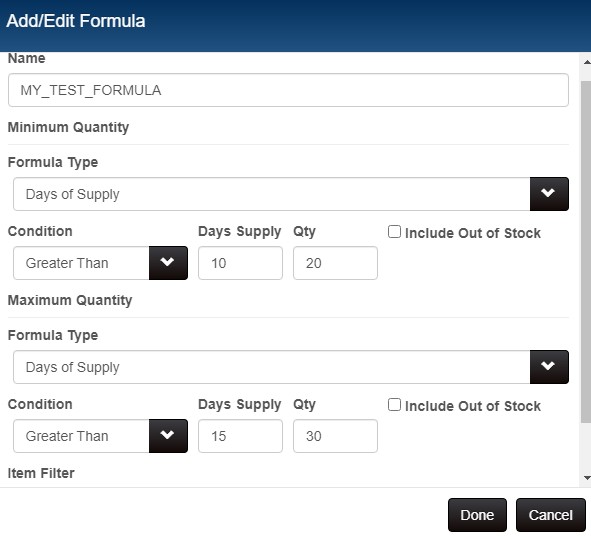
In the Add/Edit Formula modal, type a Name for the formula and define settings for both the Minimum Quantity and Maximum Quantity as needed. The available settings are slightly different depending on the Formula Type selected (Days of Supply or Annualized Sales).
Sample Add/Edit Formula screen (Days of Supply):
Add/Edit Formula Fields
| Field | Description |
|---|---|
| Formula Type | Select Annualized or Days of Supply Annualized: Use the Annualized formula type to calculate Min/Max values based on a smaller or larger percentage of the Annual Sold Qty. For example, the Max Qty should be 30 percent of Annual Sold Qty. Days of Supply: Use the Days of Supply formula type to calculate Min/Max values based on fewer or more Days of Supply. For example, the Min Qty should be 10 days of supply. Default=Days of Supply |
| Condition | Select a condition operator to use for the comparison between the Days of Supply (or Percentage) and the Qty. Select Less Than or Greater Than. |
| Days of Supply | (Only available if Formula Type is set to Days of Supply) The quantity of items that would last the specified number of days before selling out, assuming the daily rate of sale remains the same as in the period selected for analysis. The formula will use the larger or smaller of Days of Supply or Qty depending on the Condition operator. |
| Qty (Days of Supply) | The Qty value is compared to the calculated Days of Supply. The formula will use the larger or smaller of Days of Supply or Qty depending on the Condition operator. |
| Percentage | (Only available if Formula Type is set to Annualized) When the formula type is set to Annualized, Auto Min/Max calculates the Annual Sold Qty (based on the date range selected for the analysis) and then applies the Percentage entered by the user. For example, if Annualized Sold Qty is 200 and the entered percentage is 10, that would be 20. |
| Qty (Annualized) | When the formula type is set to Annualized, Auto Min/Max calculates the Annual Sold Qty (based on the date range selected for the analysis). The Qty value is compared to the calculated Percentage. The formula will use the larger or smaller of Percentage or Qty depending on the Condition operator. |
| Include Out of Stock | This checkbox is used for special situations when you want to include days in which there was a zero OH Qty when calculating Min/Max values. By default, the Out of Stock checkbox is not selected If selected, Prism will calculate the sold quantity as usual, but when calculating the number of days, will EXCLUDE those days when on-hand quantity was zero or negative by the end of the day. |
| Item Filter |
Click the Item Filter drop-down and select the desired filter element. After selecting one or more filter elements, enter filter criteria for each element. The formula is applied to items that match the defined filter criteria. |
Sample Add/Edit Formula modal (Annualized sales):

Item Filters on Formulas
A formula can include an item filter. When an item filter is included, the formula is applied only to items that match the defined filter criteria. When multiple formulas are defined, Auto Min/Max uses the formula record whose item filter criteria most closely match the item. For this reason, if using multiple item filters, the filters should be defined in descending order from most general to most granular.
Multiple elements (e.g., DCS and Vend Code) can be added to each item filter and multiple instances of an element can be added. Most of the main fields used for Inventory items are available for selection in the item filter.
- A formula with no assigned item filter will be applied to all items.
- If there are one or more formulas and no formula record can be applied to a particular item, the proposed Min/Max Levels for the item will be set to zero.
New Item Filter
While editing a formula, click the Item Filter drop-down and select the desired element (e.g., Description 1). Select an operator (e.g., "Contains") and select or type criteria for the element. Different elements are linked by the AND operator. Instances of the same element are linked by the OR operator.
Sample Item Filter for items that are in the "GI" department (DCS SID) AND have a Description 1 field entry that includes the text string "CHECK" OR "LOOKUP."

When Auto Min Max is run, the results show that only items belonging to the selected department and with the entered Description 1 text have entries in the New Min Qty, New Max Qty fields.
Zero Vales in Formula Records
A zero entry in the Days of Supply (DOS), Qty, or Percentage fields in a formula record tells Auto Min/Max to disregard these values when auto-generating New Min Qty and New Max Qty. However, if applicable, a calculated value of zero for Days of Supply (DOS) or Percentage is taken into consideration during the auto-generation process.
This is an important distinction in formulas that utilize the Less than condition. A value of zero in the Days of Supply (DOS) field in a formula record does not mean that Days of Supply (DOS) will automatically be the smallest value because it is zero. Instead, the zero tells Auto Min/Max not to take Days of Supply (DOS) into consideration when auto-generating Min/Max levels, whatever value it may be.
However, a calculated value of zero will be taken into consideration when auto-generating Min/Max levels. Say, for instance, that the calculated 30 days of supply for a particular item is zero. In this case, Days of Supply (DOS) would have the smallest possible value and zero would be the generated Min or Max level.
Days of Supply Formula Type Example
This example looks at how Auto Min/Max calculates the New Min Qty/New Max Qty when the Formula Type is set to Days of Supply. The example calculates Min/Max for a single item (#505) that has a limited sales history using the formula in the following screenshot.
When the formula type is set to Days of Supply, the user enters two values: Days of Supply and Qty.
- The Days of Supply value entered by the user represents the quantity of items that would last the specified number of days before selling out, assuming the rate of sale remains the same as in the period selected for analysis.
- The Qty value is compared to the DOS value and functions as either a floor or ceiling depending on the selected Condition operator.
In this example, because the item has a limited sales history (i.e., a new item) and the Condition operator is set to Greater Than, the Qty value will be used. The Qty field is required, and the Condition operator is set to Greater Than by default.
Sample Formula record with Formula Type set to Days of Supply:

Sample Results showing New Min Qty/New Max Qty with Formula Type set to Days of Supply. Because the item has a limited sales history, both the New Min Qty and New Max Qty are set by the Qty value (Qty value is greater than the calculated Days of Supply):

Annualized Formula Type examples
The example calculates Min/Max for a single item (#505) that has a limited sales history using the formula in the following screenshot. Because the sales history is limited (few units sold), the Qty value ends being greater than the Percentage of annual sales. Note: This is a simple example intended to explain Auto Min/Max concepts; it is not intended to be a real-world example.
Sample formula record with Formula Type set to Annualized. The proposed New Min Qty will be set to the greater of 2 percent of the Annual Sold Quantity or 10. The proposed New Max Qty will be set to the greater of 10 percent of the Annual Sold Qty or 20.

Annualized Formula Type Example Results
When the user runs Auto Min Max using the example formula, the following results are returned:
- Auto Min/Max sets the New Min Qty to 10 for Item #505. This is because the Qty value (10) is greater than two percent of the Annual Sold Qty.
- Auto Min/Max sets the New Max Qty to 37 because 10 percent of the Annual Sold Qty is 37, which is greater than the Qty (20).
Sample New Min Qty/New Max Qty with Formula Type set to Annualized; the New Min Qty was set by the Qty value in the Min Formula while the New Max Qty was set by the Percentage value in the Max Formula:

Example 2
In this example, the Date Range for the sales analysis is "Today." On this day, the store sold 50 units. To arrive at the Annual Sold Quantity, 50 is multiplied by 365 for a total of 18,250.

In the example formula, the Min Qty is set to the greater of 100 percent of the Annual Sold Quantity or 75. One hundred percent of the Annual Sold Qty is 18,250, which is greater than 75, so 18,250 is entered as the proposed New Min Qty. The Max Qty is set to the greater of 200 percent of the Annualized quantity or 150. 36,500 is greater than 150 so 36,500 is entered as the proposed New Max Qty.

Sample results for annualized example 2:

Formula Date Range
The date range selected for the analysis can play a key role in determining the final values generated (whether using Days of Supply or Annualized). Both formula types examine sales history and use that history to determine how many units are sold per day or on an annualized basis. If the data encompassed by the selected date range is not representative, then the proposed New Min Qty/New Max Qty values may not be useful. In addition, if the Condition operator is set to "Less Than," Auto Min Max could potentially come up with New Min Qty/New Max Qty values of zero.
If the date filter is set to a date before the item's Created Date, Auto Min/Max will use the item's Created Date. For example, if the date filter is set to evaluate from 01/01/2023 to 01/01/2024 and there is an item created on 12/01/2023, Auto Min/Max will only evaluate from 12/01/2023 - 01/01/2024
Min/Max Formula Examples
| Condition | DOS | Qty | Perc | Annualized | Out of Stock | Min/Max Level |
|---|---|---|---|---|---|---|
| Greater than | 90 | 40 | 0 | 0 | No | Min or Max will be whichever value is the greatest: 90 days of supply, 40 items, the annualized sold qty + 5%, or the annualized sold qty. |
| Less than | 60 | 30 | 0 | 0 | No | Min or Max will be whichever value is the least: 60 days of supply, 30 items, the annualized sold qty + 10%, or the annualized sold qty. |
| Less than | 30 | 15 | 0 | 1 | No | Min or Max will be whichever value is the least: 30 days of supply or 15 items. |
| Less than | 0 | 12 | 0 | 1 | No | Min/Max will always be 12. |
| Greater than | 60 | 0 | 0 | 1 | No | Min or Max will always be the quantity for 60 days of supply. |
Run Analysis
After defining Details and Formulas on the Calculate Min Max screen, click the Save button. After the information is saved, the Run button is enabled on the bottom menu.
When the user clicks the Run button, the Sales Analysis calculates how many units of each item were sold on average each day during the defined date range and uses that information to determine the appropriate New Min Qty and New Max Qty.
If no item filter was used, then the Results pane will list New Min Qty and New Max Qty for all items. If an item filter was used, the Results pane
Review New Min Qty/New Max Qty
After the calculation is complete, review the New Min Qty and New Max Qty values calculated by Auto Min/Max. If you are satisfied with the values, click the Update button. If needed, clear min/max and re-run the analysis.
| Element | Notes |
|---|---|
| SBS Selection. | Select the individual subsidiary to be reviewed. |
| Store Selection | Select the stores to be reviewed |
| Total Records | Shows total records included in the analysis. |
| Min Qty | The current Min value in Inventory. |
| Max Qty | The current Max value in Inventory. |
| New Min Qty | The proposed Min value calculated by the utility. |
| New Max Qty | The proposed Max value calculated by the utility. |
| Company Min Qty | Current Company Min Qty. |
| Company Max Qty | Current Company Max Qty. |
Review New Min Qty/New Max Qty via Options Menu
To review Min/Max values click the Options button and select Min Max Review.
Sample Inventory Min/Max screen (Review Min Max):

Update Min/Max
After reviewing the proposed New Min/New Max values, click Update. Update copies the New Min Qty/New Max Qty values to the Inventory Min Qty and Max Qty fields, overwriting the existing values, if any.
You have two options for updating:
- Update Quantities Only: (Default) Only items with values in the New Min Qty and New Max Qty fields will be updated.
- Update All Items: If you select Update All Items, all items in the list will have the New Min Qty and New Max Qty values written to the Inventory Min Qty and Max Qty fields, even if this means a value of zero will be written to the Min Qty /Max Qty fields.
Sample Update Min/Max options:

After update, the New Min/New Max values are copied to the Min and Max fields and the New Min/New Max fields are cleared.
Update Company Min Max values
If the "Update Company Min Max" checkbox is selected, store min/max values are combined and the values are entered into the Cmp Min and Cmp Max fields. If not selected, company min/max values are left at zero.
Clear Min/Max
You can clear the values entered in the New Max and New Min columns as well as the Inventory Min and Max columns. This is useful when you want to start the Auto Min/Max process over using different criteria for calculating the values. This is also useful in the use case where you don't want to update Min Max for all stores; use the Clear Min/Max feature to clear the New Min/New Max values for those stores that should not be updated.
- Min: Inventory Min
- Max: Inventory Max
- New Min: The current New Min (either calculated or entered manually)
- New Max: The current New Max (either calculated or entered manually)
- Clear Company Min/Max: Clears the company values.
Sample Clear Min/Max modal:

Affected Database Tables and Columns
When the user clicks the Clear button, the Qty values are set to zero as applicable in the following tables and columns:
INVN_MINMAX table and INVN_MINMAX_QTY table
CMPN_MIN_QTY, CMPN_MAX_QTY, MIN_QTY, MAX_QTY, NEW_MIN_QTY, NEW_MAX_QTY, MINMAX_BEGIN_DATE, MINMAX_END_DATE
Copy Min/Max
An easy way to populate the Min/Max values for a store is to copy the existing Min/Max values that have already been calculated for a different store. This can be a useful technique if the stores share similar inventory, annual sales, etc.
Navigate to the Review Min/Max screen.
From the dropdowns, select the Subsidiary and Store whose Min/Max values will be copied.
Click the Copy button on the bottom menu. The Copy Min/Max modal is displayed.
Select the individual Stores that will have their Min/Max values overwritten by the copy.
Select the specific Min/Max values to copy:
- Min
- Max
- New Min
- New Max
For each selected store, a new record is created in the INVN_MINMAX_QTY table. The STORE_SID is different on each of these records.
Min/Max Grid Formats Preferences
Add Min/Max fields to the grids for the following areas:
- Inventory Min/Max
- Inventory Lookup (Store Min Qty, Store Max Qty)
Store Max Qty and Store Min Qty moved from the Available list to the Selected list (which automatically adds the columns to the Default Visible list:

Min/Max Fields in Inventory Records
Min Qty and Max Qty information can be viewed in Inventory Item Details on the Qty tab and the Purchasing tab. On the Qty tab, Min Qty and Max Qty for the item at all stores in the selected Subsidiary are displayed. On the Purchasing tab, Min Qty and Max Qty as well as extended cost and price for the currently selected Subsidiary and Store are displayed. In edit mode, users can edit the Store Min Qty and/or Store Max Qty fields on the Purchasing tab if needed.
Sample Inventory Item Details - Purchasing tab - Store Min/Max section:

The following Min/Max fields are available in Inventory > Item Details > Purchasing tab, in the Store Min/Max area:
| Field | Description |
|---|---|
| Min Qty | Minimum desired stock level. |
| Ext Cost | Extended Cost of the item at the Min Qty (Min Qty x Cost). |
| Ext Price | Extended Price of the item at the Min Qty (Min Qty x Price). |
| Ext Price WT | Extended Price with tax of the item at the Min Qty (Min Qty x Price WT) |
| Max Qty | Maximum desired stock level. |
| Ext Cost | Extended Cost of the item at the Max Qty (Max Qty x Cost). |
| Ext Price | Extended Price of the item at the Max Qty (Max Qty x Price). |
| Ext Price WT | Extended Price with tax of the item at the Max Qty (Max Qty x Price WT) |
Note: Inventory Items also have a "Minimum Order Qty" field; however, this field is unrelated to Min/Max. The "Minimum Order Qty" field stores the minimum quantity required by the vendor on an order for specific items and it is enforced when adding items to a PO.
Replication of Min/Max
To send Min/Max information for Inventory items, select the invnminmax resource in the profile. Care should be taken when selecting this resource to avoid replicating excess data. When the invnminmax resource is selected, Prism replicates the updated Min/Max values only. Configuration for Auto Min/Max and proposed New Min/New Max values are not replicated.
Sample replication profile with the invnminmax resource selected:
